Receive one-time update if document changes:
Image Guide
Introduction
This guide is a resource to enable you to create higher quality images for your IGI Global publication. It is written for the lay-user with limited experience with graphic design or photo editing. This guide includes some tools that will make it easier to assess your images prior to submitting them.
The industry standard for high-resolution images is a minimum resolution of 300 dpi (dots per inch). Images with lower resolutions will appear blurry or "blocky" in print. Computer monitors typically have a display setting of 72 dpi, which means that low resolution images may not always appear as such when viewed on your monitor. Another thing that you will need to consider is the approximate size that you intend for you image to appear within the publication: full page, half page, or quarter page.
If you continue to experience any problems with creating or assessing images, please feel free to reach out to your publication's Development team contact for further assistance.
Contents
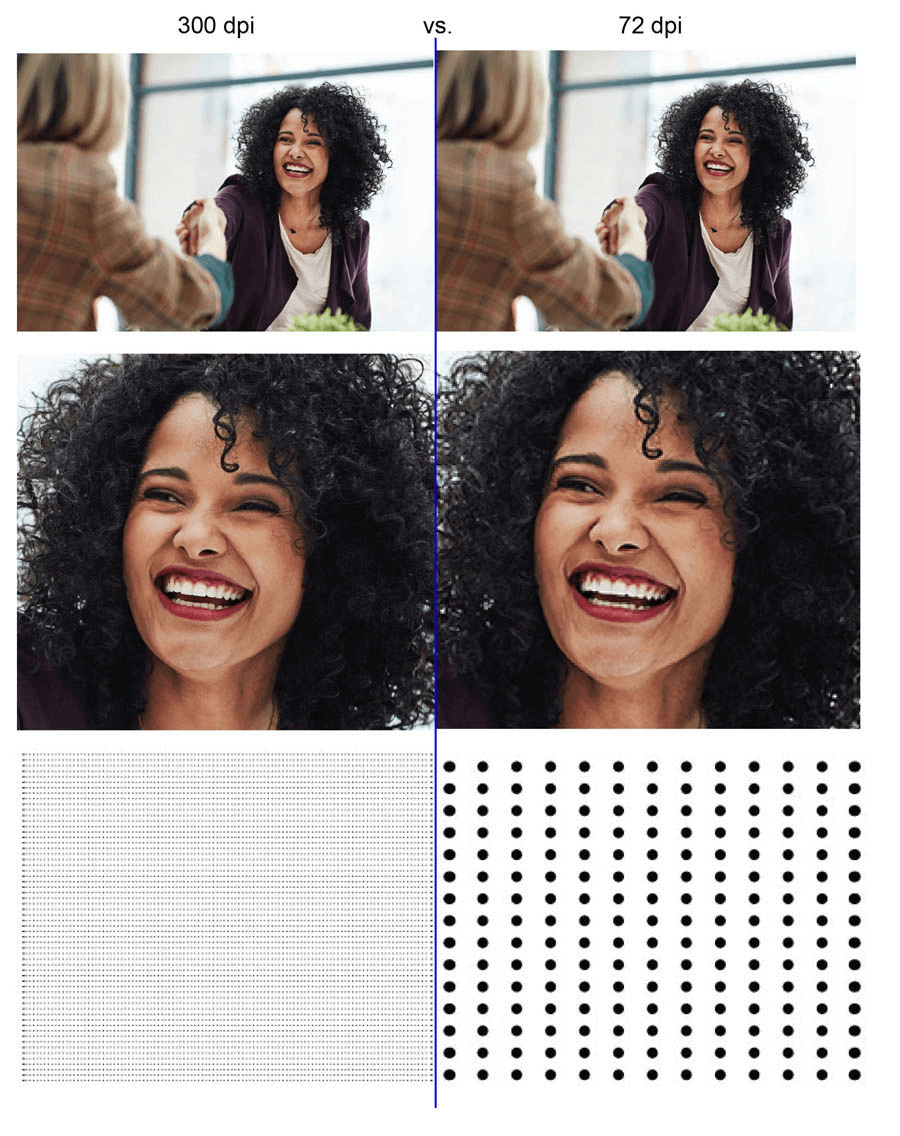
TopImage Quality: 300 DPI vs. 72 DPI
To have sharp and clear images, we need the images to be 300 dpi (300 dots per inch): this is standard across all printing. Low-resolution images print fuzzy, jagged and blurry. Most computer monitors generally have a display setting of 72 dpi. If some of your images are low resolution, they may not look bad on your monitor but will likely print blurry.
TopHow to Find Pixel Sizes
Mac
- 1. Highlight image file
- 2. Hold Ctrl + Click on selected image
- 3. Select “Get Info” in Drop-down menu
- 4. Select “More Info”
- 5. Look at Dimensions (displayed in pixels)
- 6. Refer to image size chart
- 7. If the image is too small, please either obtain a better-quality image or choose a different file
PC
- 1. Right-Click image file
- 2. Click “Properties” (Bottom of Drop-down menu)
- 3. Select “Details” Tab
- 4. Scroll down to “Image”
- 5. The Dimensions will be displayed in pixels and DPI
- 6. Refer to image size chart
- 7. If the image is too small, please either obtain a better-quality image or choose a different file
![Image Size Table]()
When assessing the font sizes in the image, keep the desired approximate image size (full page, half page, quarter page) in mind. In general, the font look best when the approximate size is between 11pts and 8pts. The font size should not go below 6pts because they become virtually unreadable at smaller sizes. Black letters on a white background are the best color scheme for readability.
TopColor vs. Grayscale Images
For most of our publications, IGI Global prints physical copies in black and white; however, the electronic versions of the same publications can also use color. Because of this it is important to factor in the image’s appearance in grayscale when designing/selecting figures. If the image’s grayscale appearance is not considered, you may find that the information you are presenting is not properly conveyed to the reader. Here are a few examples of figures that appear differently in grayscale when compared to color.
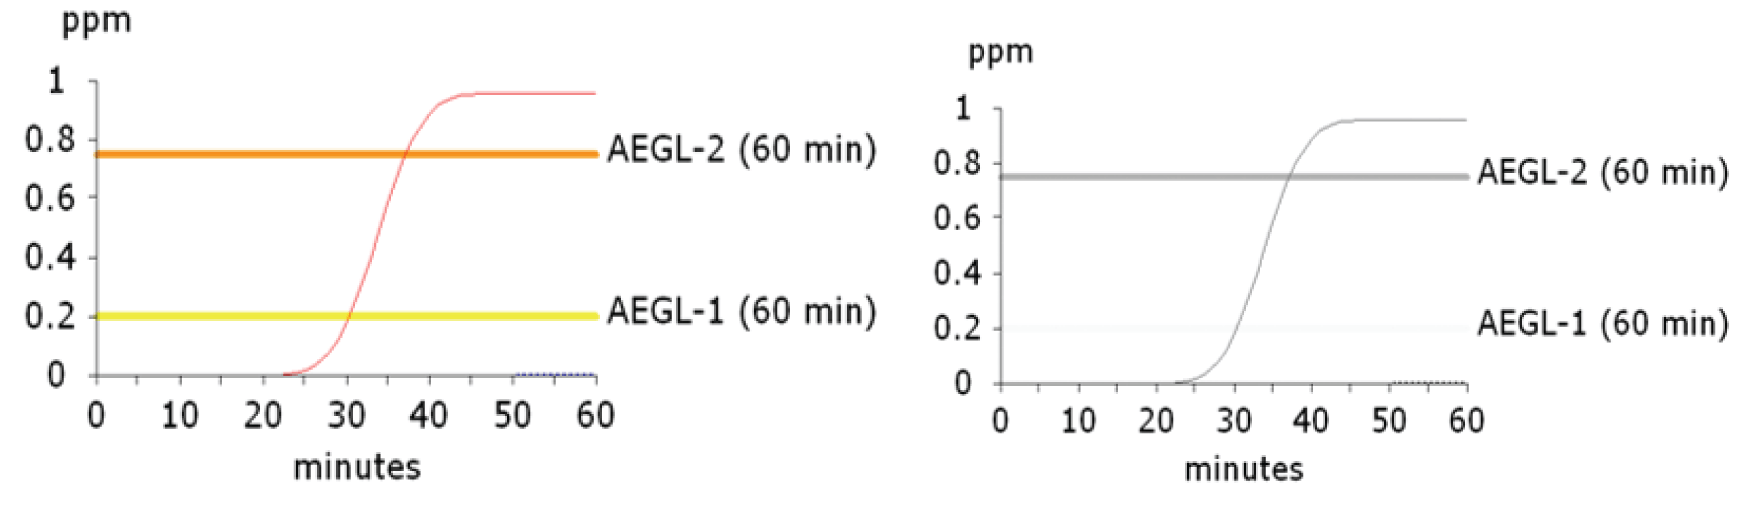
The yellow line featured in the above graph disappears when the image is converted into grayscale
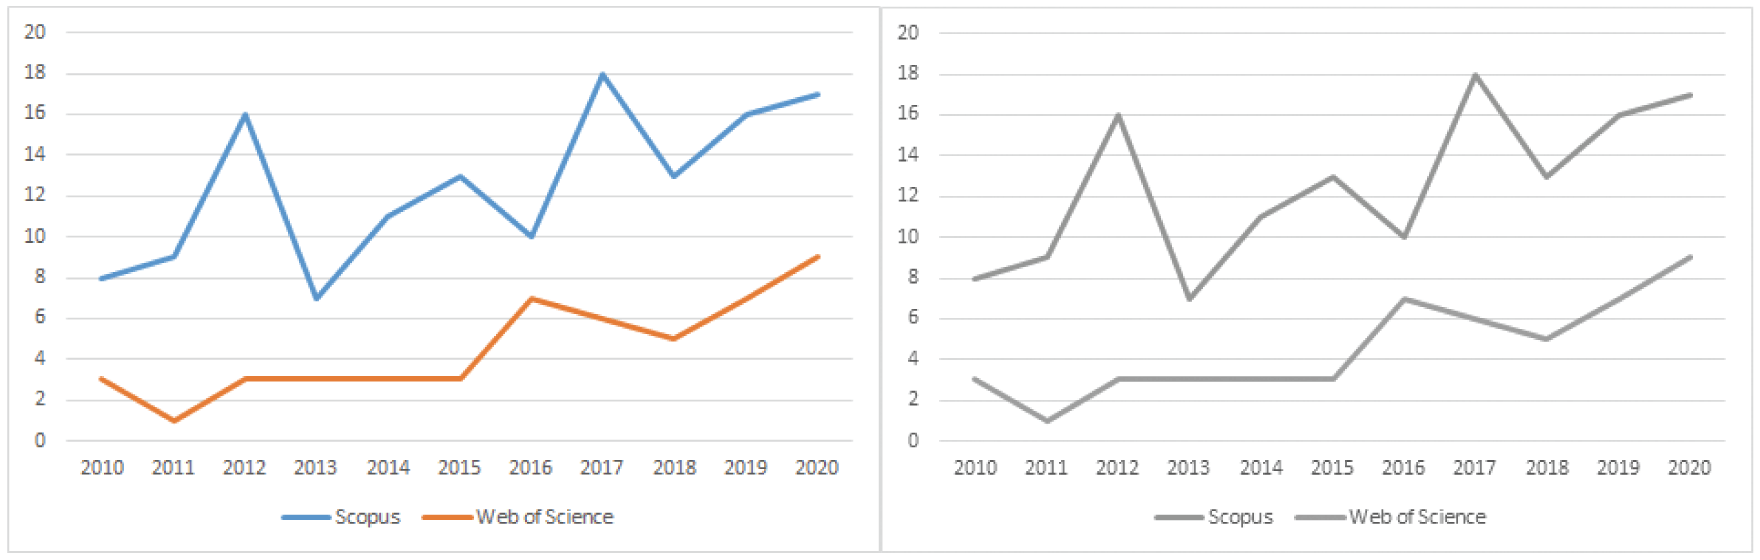
While the blue and orange lines are clearly distinguishable in color, they become impossible to tell apart in grayscale
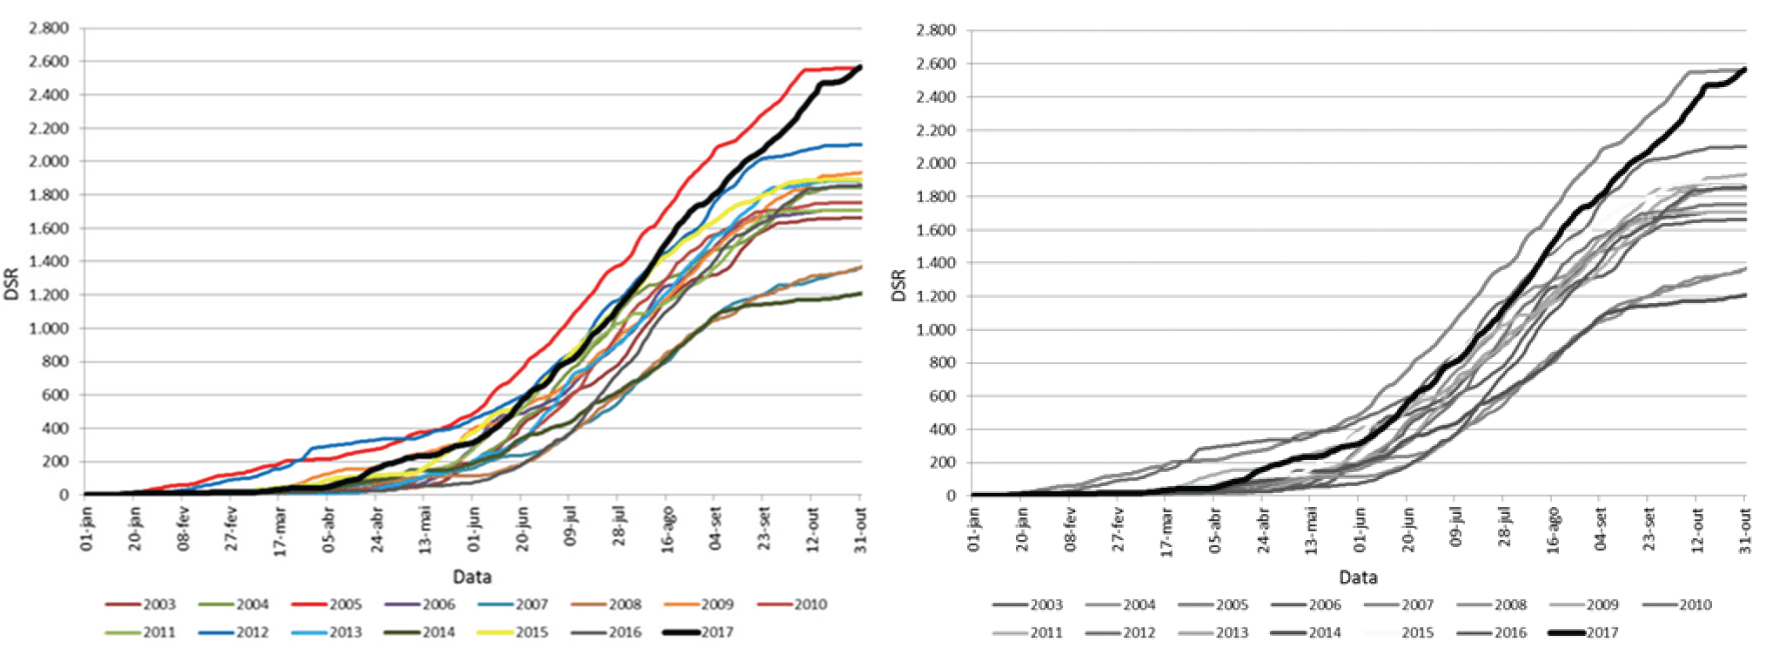
This graph tracks 15 different data samples which makes it difficult to read even in color. The task becomes impossible after the image is converted into grayscale as many of the lines became the same shade of gray.
TopPreviewing Images in Grayscale
In IGI Global’s e-Editorial Discovery Submission System, you have the option to preview any of your submitted images in Grayscale. After you have initially uploaded your images onto the platform, you can click on the Show Figures in Grayscale? Checkbox located above (right) the list of figures. Turning this on will allow you to see how any image will appear in grayscale by selecting the image’s print preview.
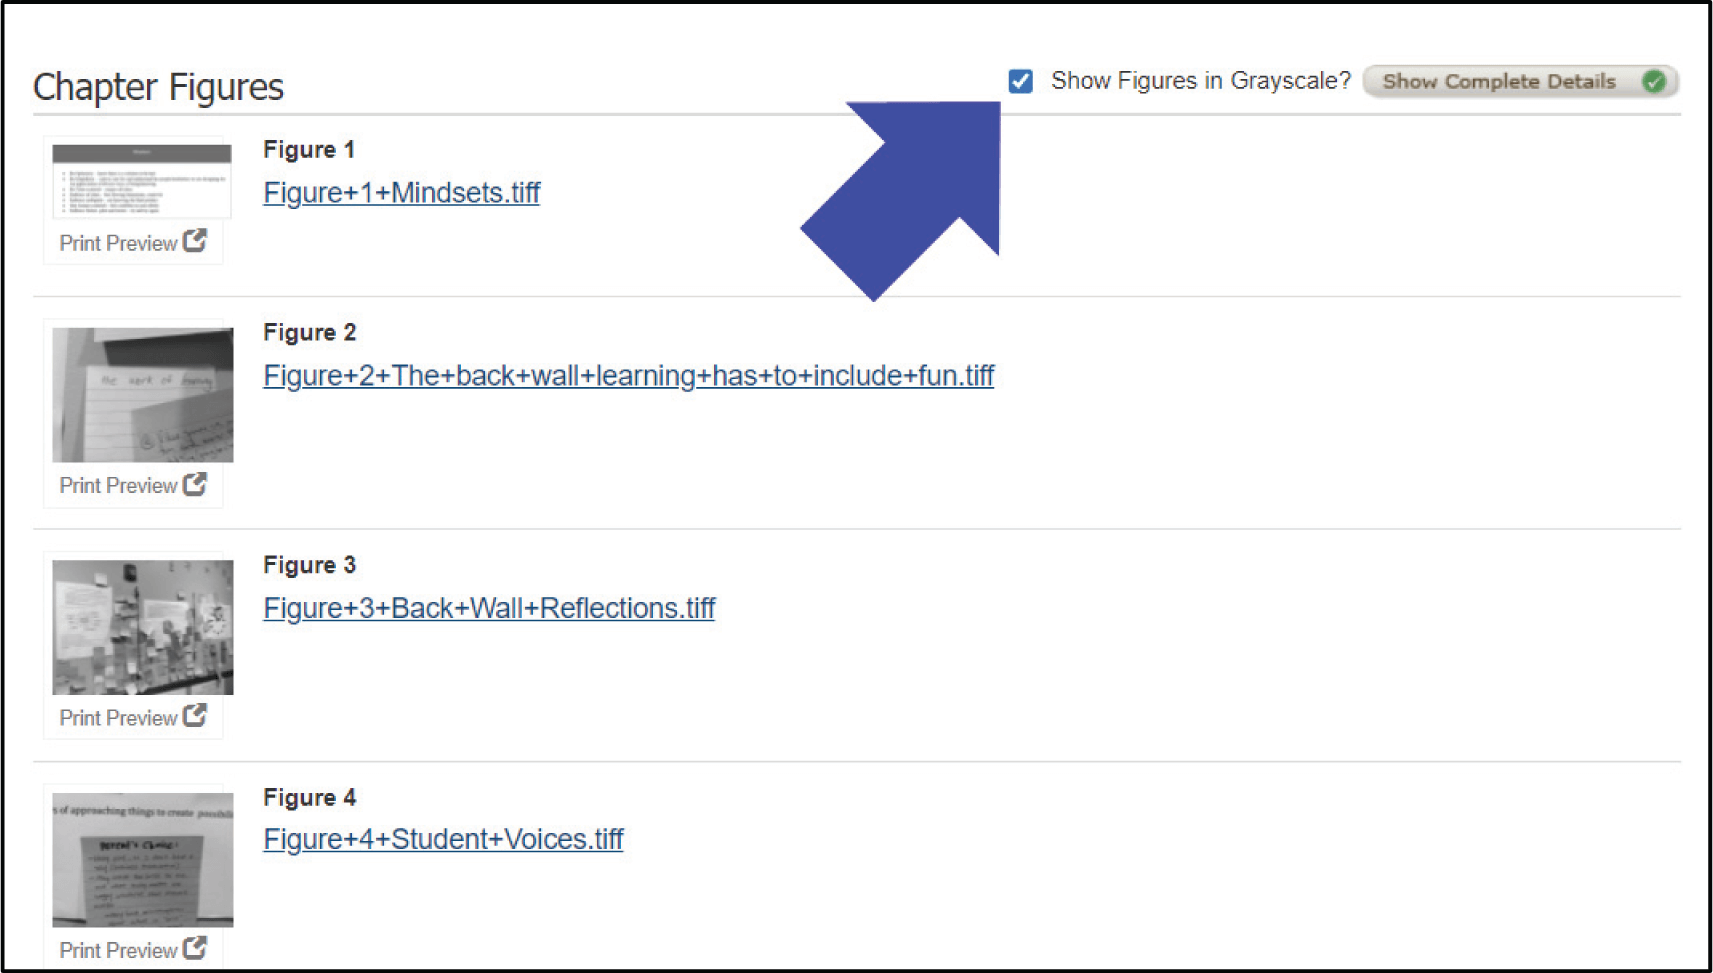
If any images appear questionable in the grayscale preview, you can then replace them with a suitable substitute.
Oftentimes you can create images that are suitable for either color or grayscale with a little bit of planning. Here are a few examples:
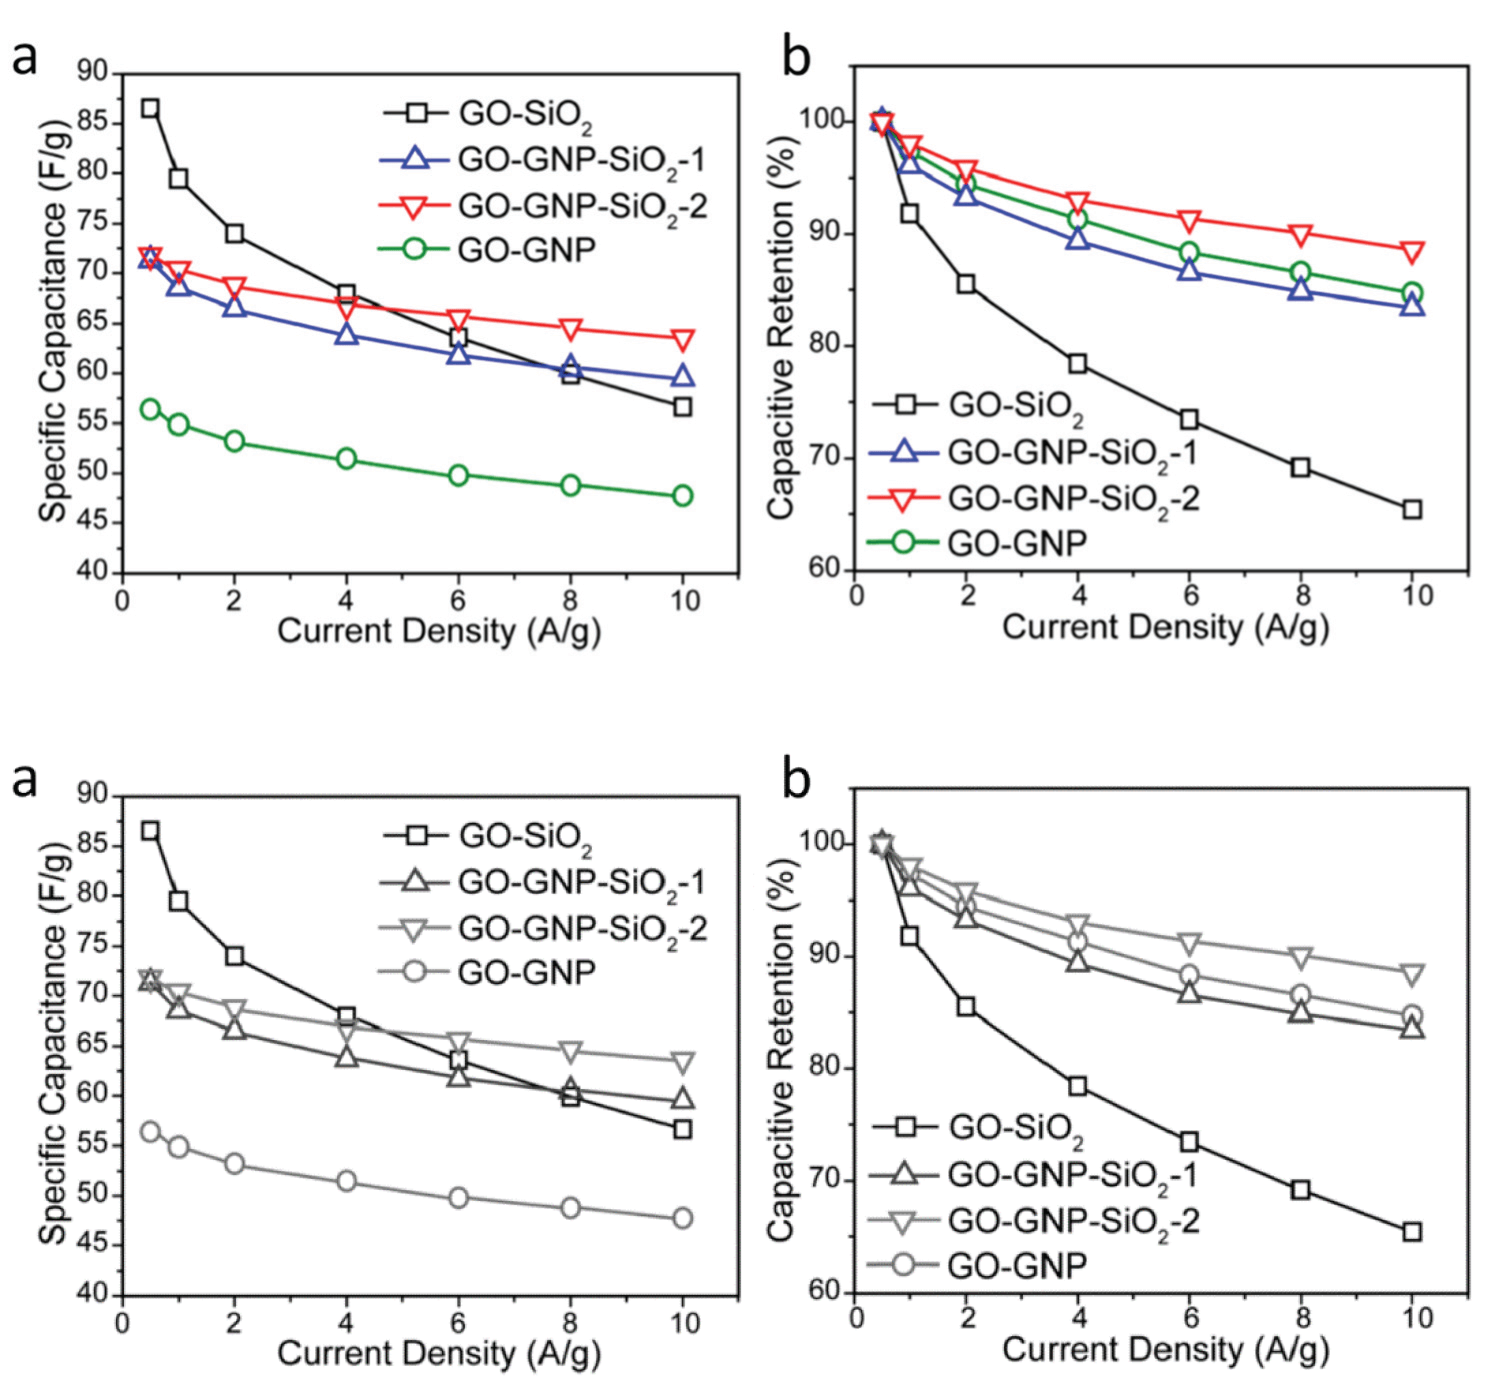
The charts in the figure above can be correctly read in either mode because the author chose to use unique markers to denote the datapoints for each line.
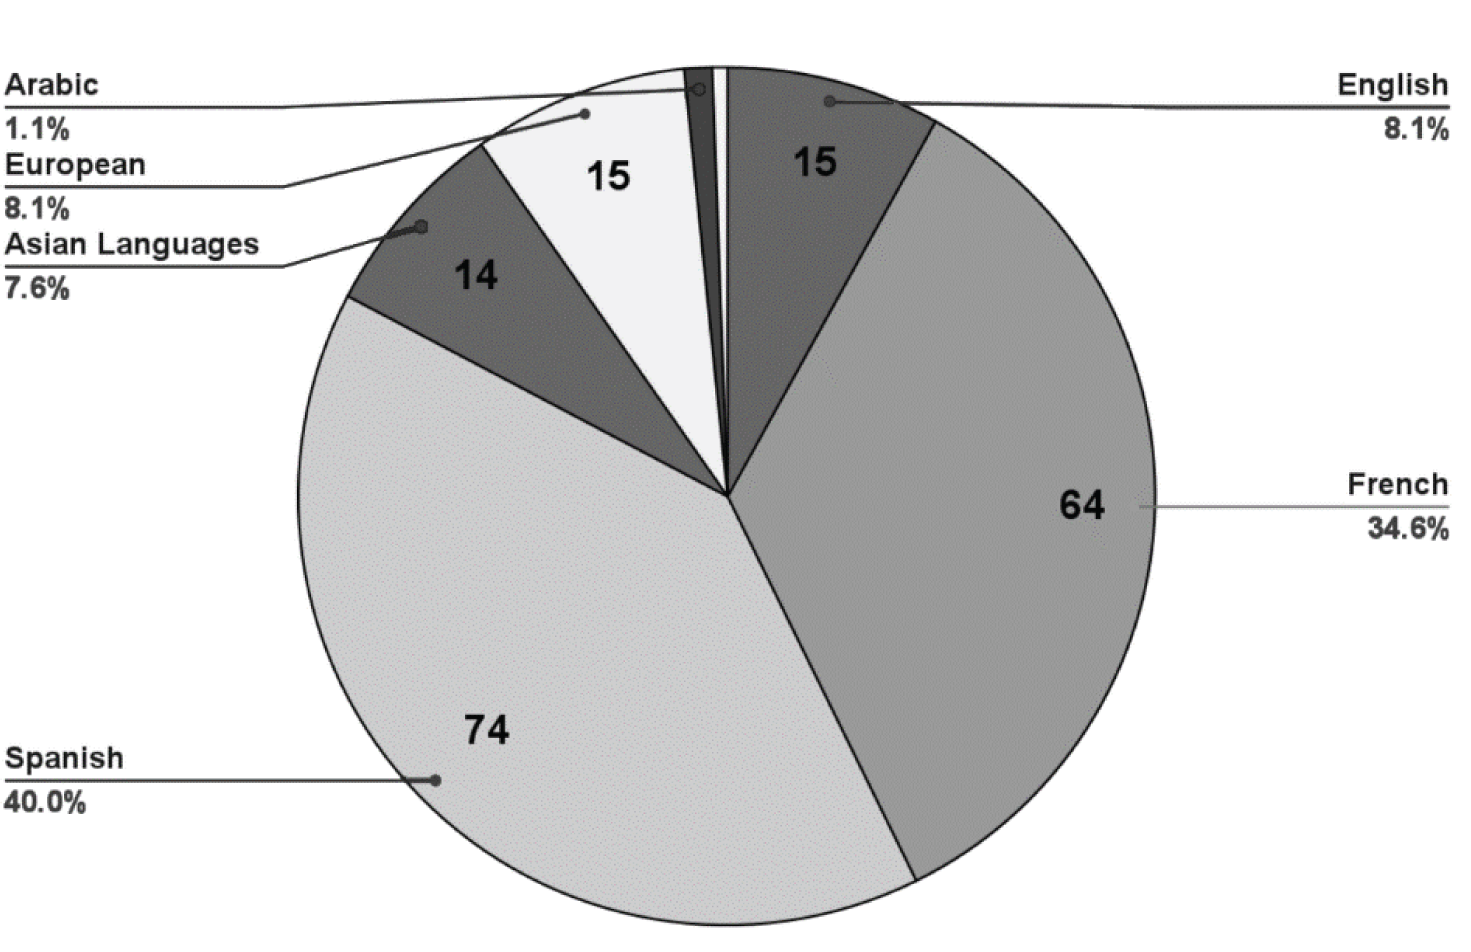
In this pie chart, the author separated each wedge with a thin border. Also note that even though the “English” and “Asian Languages” wedges are similar shades, there is no confusing them because the author chose to use labels pointing to each wedge instead of employing a separate key.
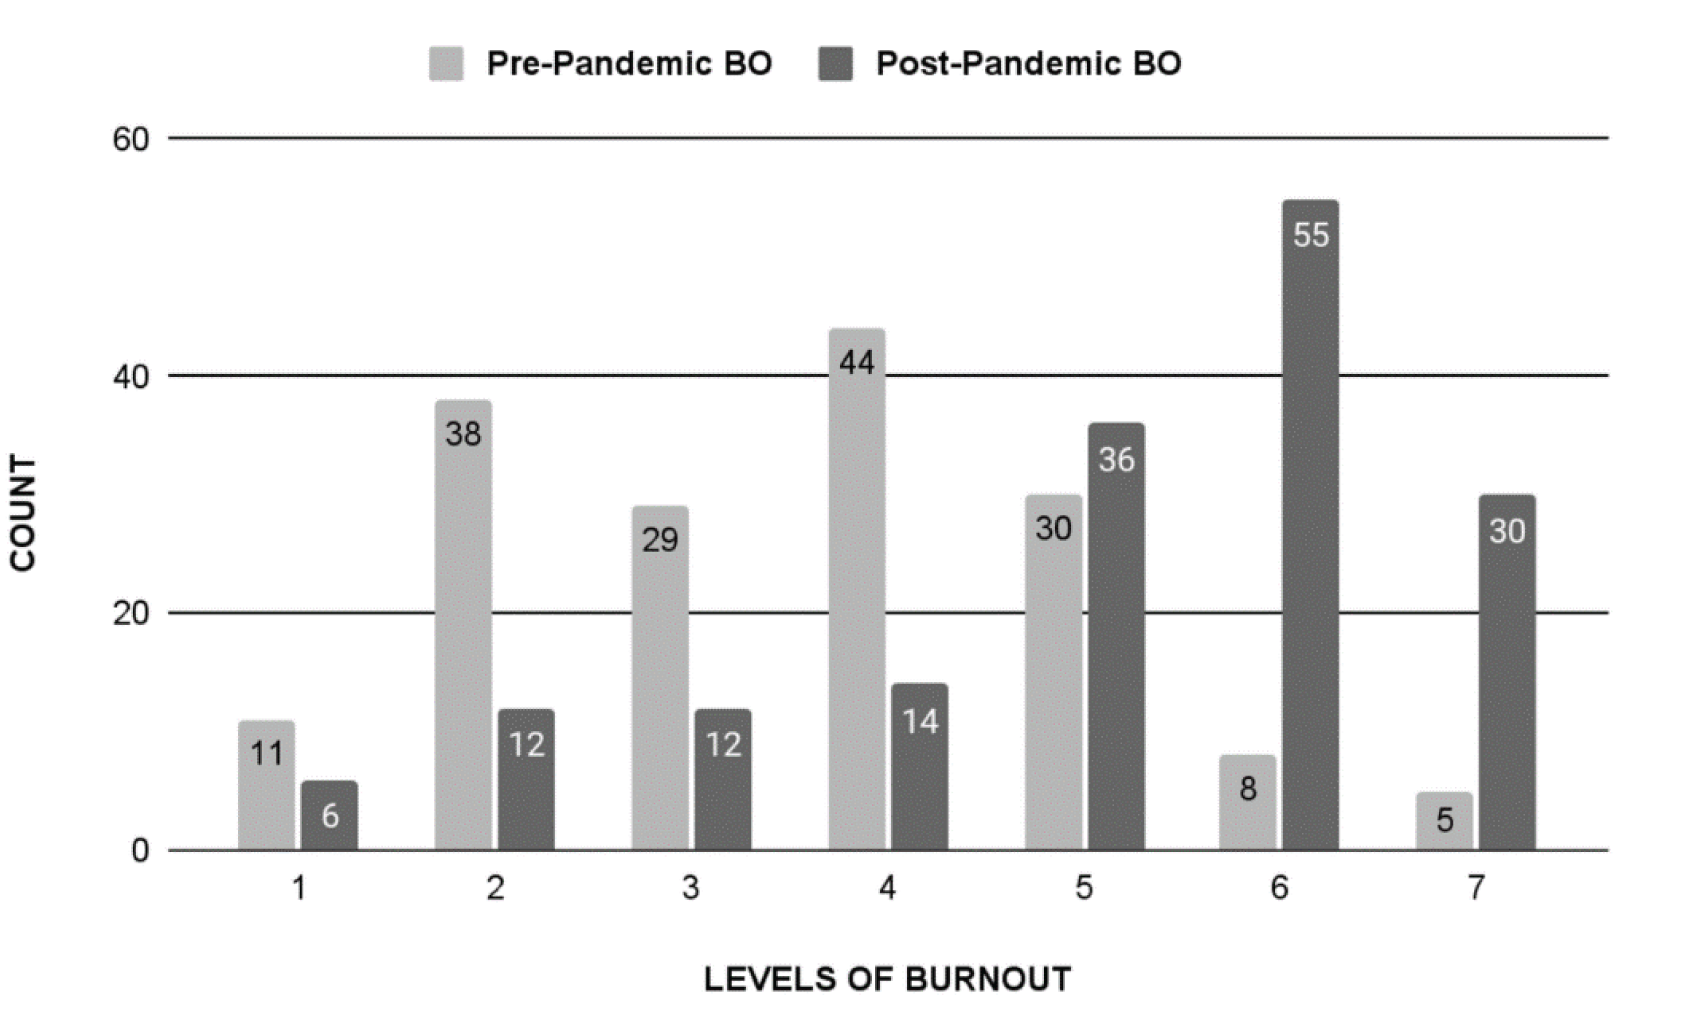
The contrast between these two shades of grey is high enough to easily tell one bar from the other.
TopConverting Images to Tif Format
Below you will find the necessary steps to convert any images you may have to Tif format in order for the images to be uploaded into the submission system alongside your submission.
Step 1
Copy the figure into Microsoft Word, Paint, Paint.net, etc. If authors are creating their figures in Word, then you can use Word for other figures as well.
Step 2A
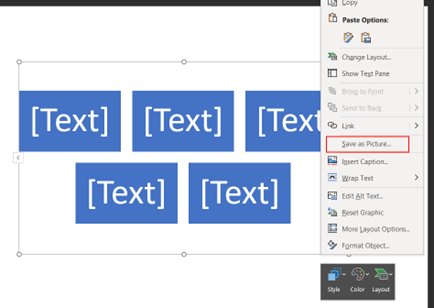
Right click on the figure to open up the menu as seen in the example below in Word. Then select “Save As Picture.”
Step 2B
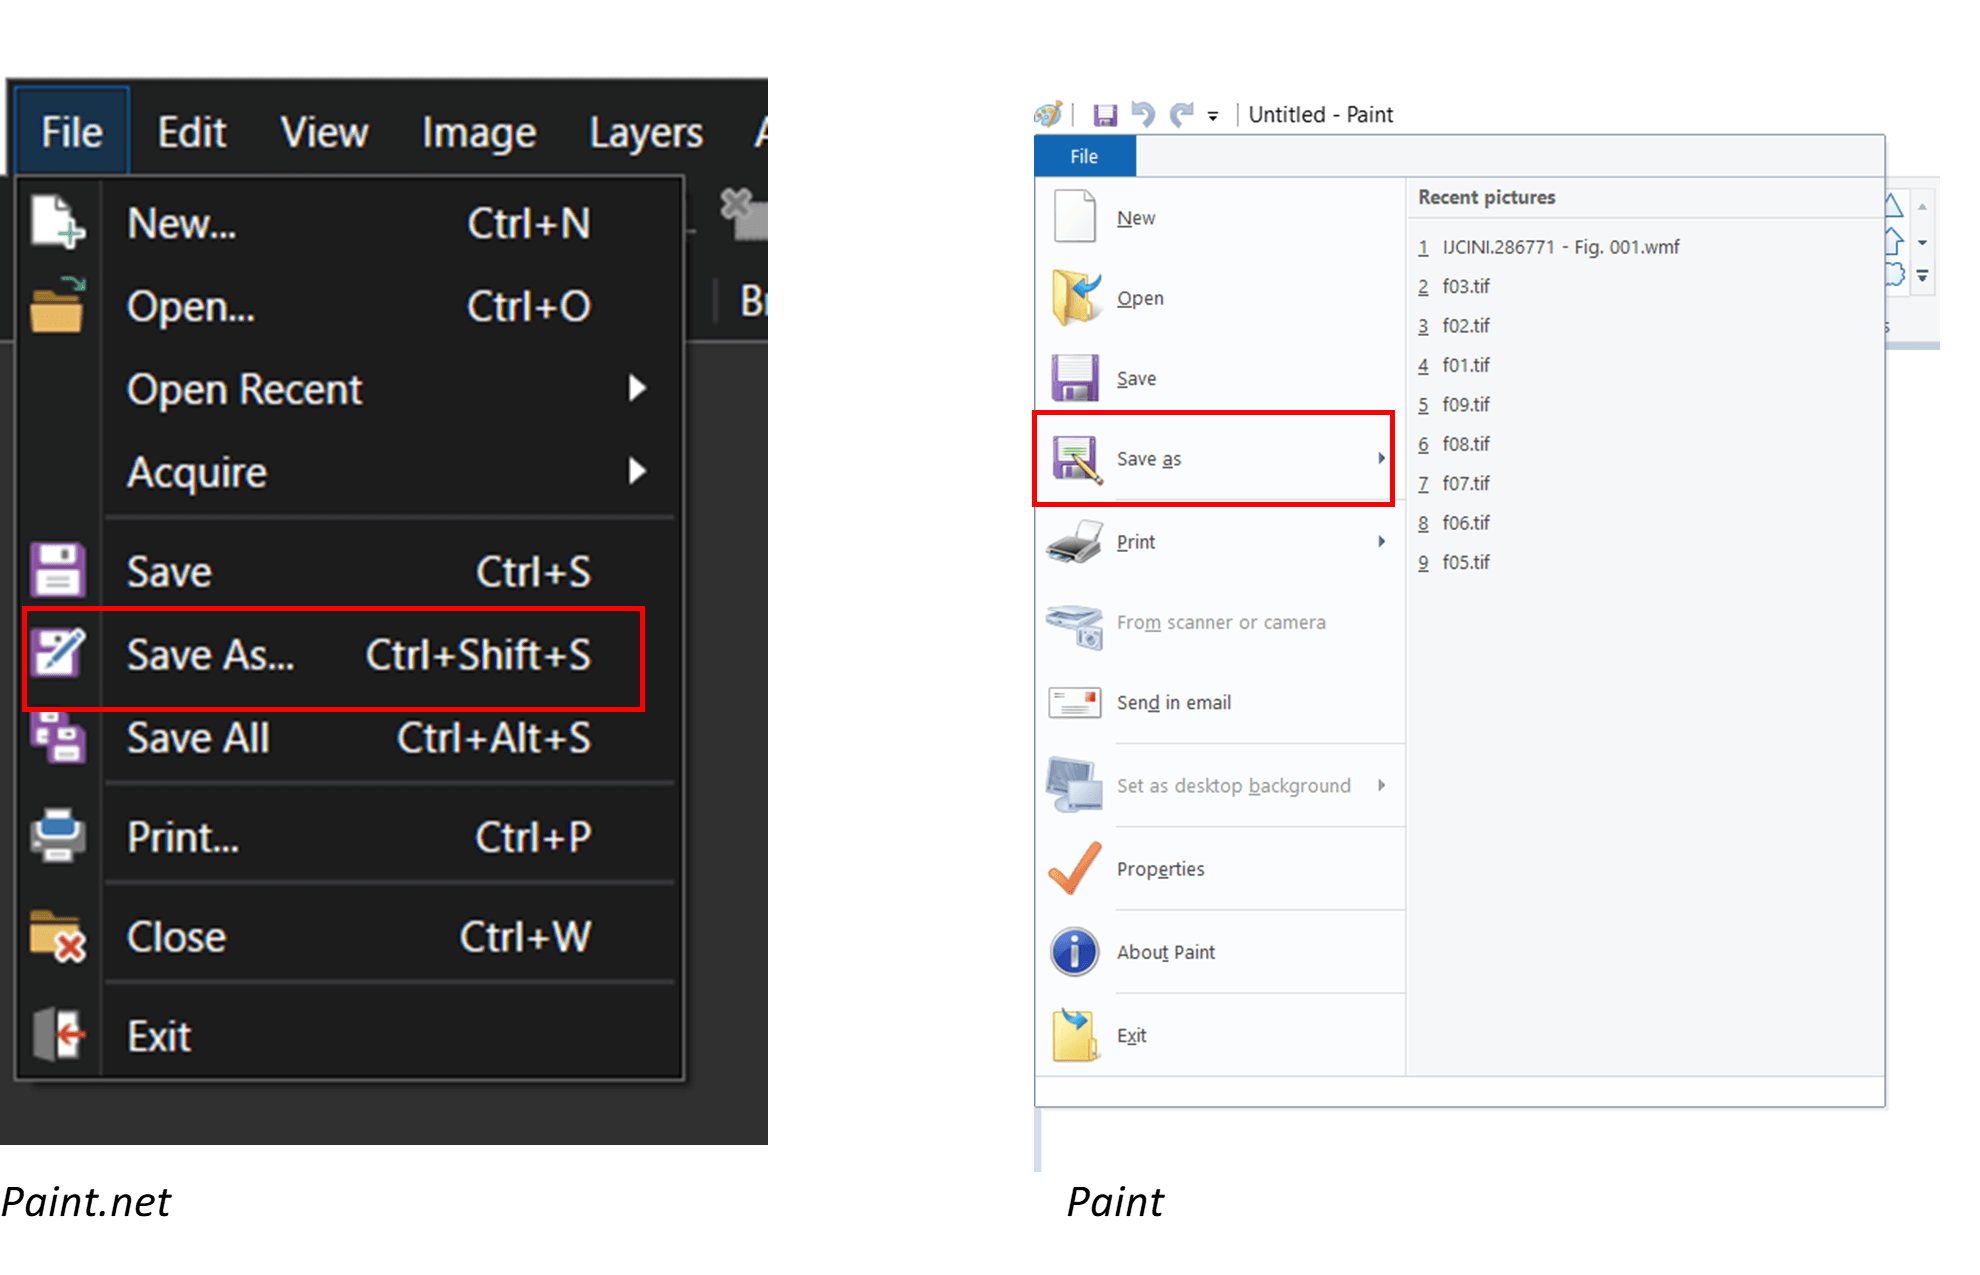
If an author is using Paint or Paint.net, please paste the figure into the open workspace and navigate to the top left to the “File” button. Please select “Save As”
Step 3
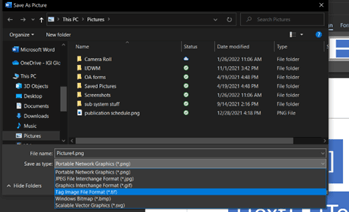
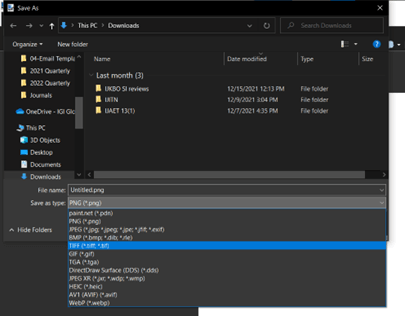
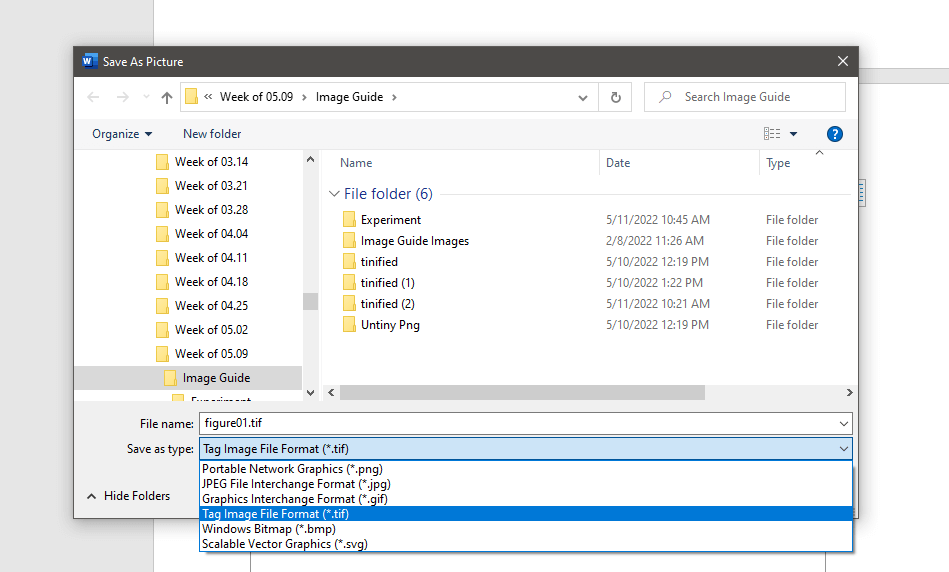
When the new box appears, please select the dropdown box to the right of “Save as Type” and change it to “Tag Image File Format” or TIFF (*.tiff *.tif) depending on the application you are using.
Word
Paint.net & Paint
Step 4
Name your image as what you would like and save it somewhere you can locate it. After this step is complete for all of your figures, you can now upload your figures into the submission system for your submission.
TopCreating Images Using Microsoft Word Shapes Tools
Microsoft Word comes preloaded with a set of Shapes tools. This is a popular method with academic authors to create simple diagrams, such as flow charts or organization charts, to accompany their research. However, like any tool, it must be used correctly so as not to cause problems in later stages of the publishing process.
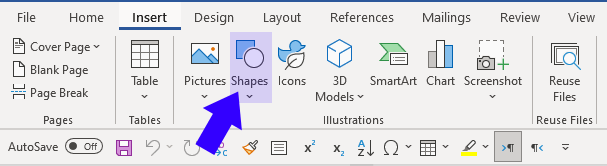
If you are using a later version of Microsoft Word, you will find the Shapes tools on the Insert ribbon.
Creating and Using a Drawing Canvas
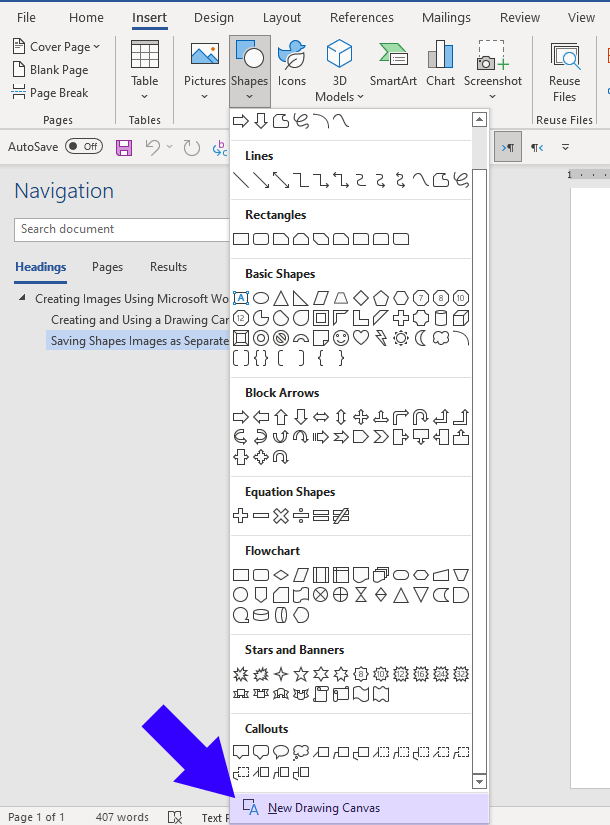
The first and most important rule to follow when creating an image for publication using the Shapes tools, is to first create a Drawing Canvas to contain the image you create. When you open the Shapes pulldown menu you will find this at the very bottom of the menu.
This creates a predefined drawing canvas area on the page.
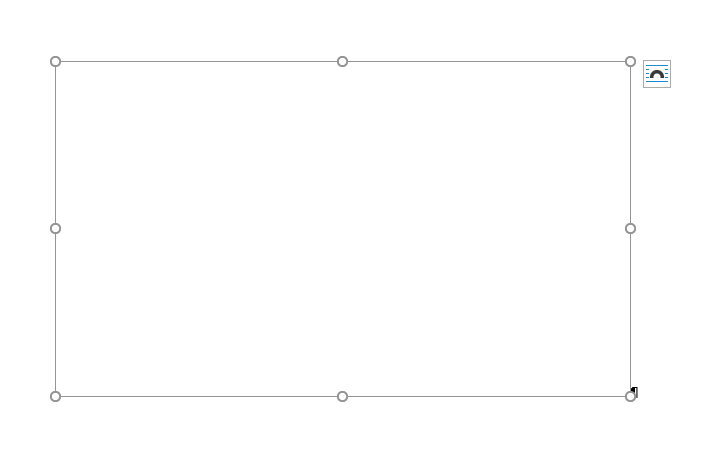
The exact dimensions of the drawing canvas can be adjusted at any time to accommodate your image. All of the shapes you use for your image must be contained within this canvas.
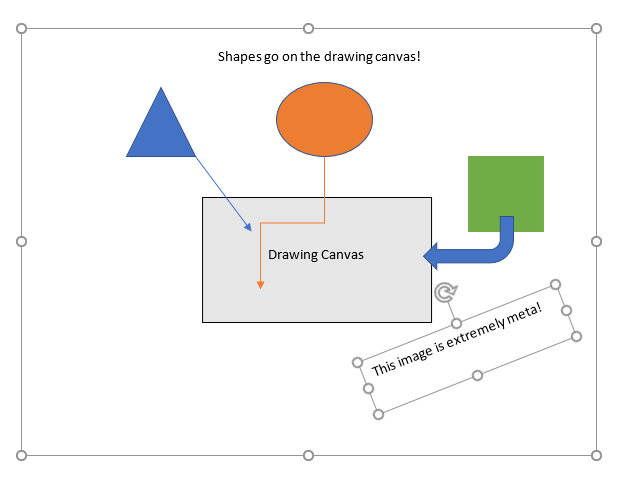
If you do not use a drawing canvas it will not be possible to save the entire image as a single image file for later submission.
In IGI Global publications, the figure caption should not be included within the drawing canvas. Instead, it should be typed directly in the body of your paper directly above the related drawing canvas. Please refer to the contributor writing guide for specifics related to the figure caption.
Saving Shapes Images as Separate Files
Any images that you create with the Shapes tool can be saved directly as an image file without the need for separate image editing software such as Photoshop or MS Paint. To do this, first select the drawing canvas, then right-click and choose the Save as Picture… option from the menu.
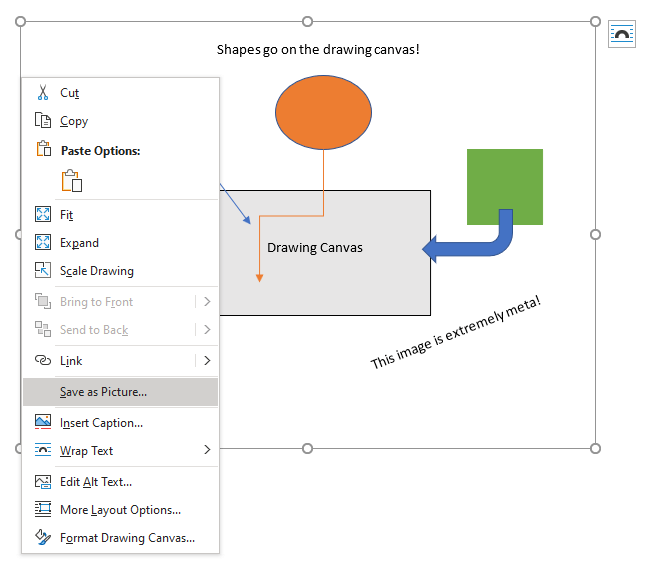
Afterwards, it is a good idea to review the images you saved as pictures for completeness and accuracy. If any shapes are missing, it is possible that they were not included on the drawing canvas. Any “loose” shapes can be cut/pasted onto the drawing canvas, positioned accordingly, then re-saved.
When saving an image intended for an IGI Global publication, choose the Tag Image File Format (tif) in the Save as Type: pulldown menu located at the bottom of the save window.
This will save the image in the correct format to upload to the e-Editorial Discovery Submission system.
Last Updated May 17, 2022